

WealthArch Investment Services watches two forces shaping markets right now: rising prices and crowded stock leadership. The latest CPI inflation reading came in hotter than expected, while a small group of artificial intelligence companies drives an outsized share of total market value. That combination has many investors asking whether the AI bubble resembles the manias that came before it. This page compares today’s market with past bubbles and lays out how we position client portfolios when prices look stretched.
Key Takeaways
- CPI inflation registered 4.2% in the latest report, higher than expected, which raises the odds of an interest rate hike later this year.
- All else equal, higher rates tend to pressure stocks, bonds, and real estate.
- By one key measure of market concentration, the AI bubble now rivals the peaks of past manias, including the dotcom bubble.
- High prices paired with higher risk argue for a more conservative, defensive stance rather than a reactive one.
- WealthArch invests with a margin of safety, so client portfolios are built to weather crowded, frothy markets.
What the Latest CPI Inflation Reading Tells Us

The Consumer Price Index, often shortened to CPI, is the most widely followed measure of inflation in the United States. In the most recent report, the reading rose to 4.2%, a figure that came in higher than economists expected.
In plain terms, the cost of everyday goods and services climbed faster than forecast. WealthArch follows these releases closely, because surprises in the data tend to move markets quickly.
Why a Hotter CPI Raises Rate-Hike Risk
When CPI inflation runs above expectations, it raises the probability of an interest rate hike later this year. Central banks lean on higher rates to cool rising prices.
All else equal, rate hikes are not good for stocks, bonds, or real estate. Higher rates make future company earnings worth less today and lift the cost of borrowing across the economy.
What Is the AI Bubble?
The phrase describes a market in which a handful of artificial intelligence names account for a large and fast-growing slice of total stock value. Enthusiasm for the technology has lifted these companies sharply.
The useful question is not whether artificial intelligence matters, because it clearly does. The better question is how much concentration that enthusiasm has produced, since concentration is what history tends to punish.
How the AI Bubble Compares to Historical Bubbles
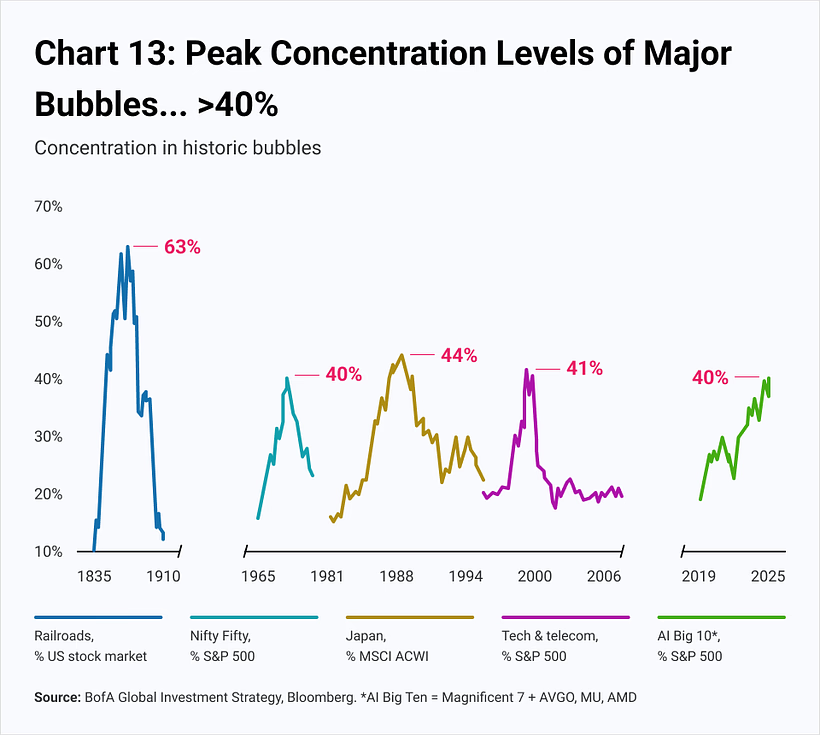
Researchers gauge a bubble partly by concentration: the share of a market held by its hottest segment. Across very different eras, that share has repeatedly climbed above 40% before trouble followed. We have written more about AI’s impact on the stock market, and here is how today’s market stacks up against earlier episodes.
Railroad Mania (Peak Near 63%)
In the 1800s, railroad shares swelled to roughly 63% of the United States stock market, the most extreme concentration on record. The buildout was real, yet stock prices ran far ahead of underlying value.
The aftermath: Academic research on the British Railway Mania found that railway share prices rose about 106% during the boom, then reversed sharply, falling 64% from peak to trough before the dust settled. In the United States, the Panic of 1873 that followed the mania was equally brutal: within months, 55 of the nation’s railroads had failed, and another 60 went bankrupt within a year, while 18,000 businesses collapsed between 1873 and 1875. Railroad construction, formerly a backbone of the economy, plummeted from 7,500 miles of new track in 1872 to just 1,600 miles by 1875. The ensuing depression, known as the Long Depression, lasted roughly six years.
Sources: Campbell (2009), CEPR; Wikipedia, Panic of 1873
The Nifty Fifty (Around 40%)
In the early 1970s, a group of blue-chip favorites known as the Nifty Fifty grew to about 40% of the S&P 500. Investors treated them as one-decision holdings, until lofty valuations corrected.
The aftermath: During the bear market of 1973 to 1974, the S&P 500 itself fell roughly 45%, but the Nifty Fifty names fell far harder. From their respective highs, Coca-Cola lost 69%, Xerox 71%, McDonald’s 72%, Disney 87%, Avon 86%, and Polaroid 91%. As a group, the Nifty Fifty dropped approximately 50% or more. Even investors who held on faced what one Nasdaq columnist described as stocks being “dead money for 10 years or more.” The longer-term lesson: a few high-quality names eventually grew back into their valuations over decades, but only those who could stomach a decade of losses ever saw the benefit.
Sources: Stray Reflections; A Wealth of Common Sense; America’s Nifty Fifty Stock Market Boom and Bust (TheBubbleBubble.com); Nasdaq
Japan’s Asset Bubble (Around 44%)
At its late-1980s peak, Japan made up close to 44% of global developed equity markets. The unwind that followed stretched on for years and reshaped a generation of investors.
The aftermath: The Nikkei 225 peaked at 38,915 on December 29, 1989. By August 1992, it had lost more than 60% of its value, and it did not stop there. By 2003, the index had fallen to approximately 7,600, a decline of roughly 80% from its 1989 peak. More remarkable still is the recovery timeline: the Nikkei did not surpass its 1989 high until early 2024, meaning investors who bought at the peak waited 34 years to break even on a price basis. The period became known as Japan’s “Lost Decades,” a cautionary reminder of how long concentrated speculation can take to unwind when it is fueled by credit and land-price euphoria.
Sources: The Japanese Asset Bubble (MyFinanceProcess.com); The Rise and Fall of the Nikkei (JapanBusinessSecrets); Japan: the ultimate stock market crash (JustETF)
The Dotcom and Telecom Bubble (Around 41%)
The closest modern comparison is the dotcom bubble. Technology and telecom shares reached roughly 41% of the S&P 500 around the year 2000 before a sharp decline. Many sound businesses still fell hard, because their stock prices had detached from real value.
The aftermath: The Nasdaq Composite peaked at 5,048.62 on March 10, 2000. By October 2002 it had fallen to approximately 1,114, a decline of roughly 78% from the peak, erasing more than $5 trillion in market value. That figure is slightly less than the 82% sometimes cited, but the pain was severe either way. More than half of publicly traded dotcom companies had failed by 2004. The Nasdaq did not reclaim its March 2000 high until April 23, 2015, meaning investors who bought at the peak had to wait 15 years just to break even.
Sources: Dot-com bubble, Wikipedia; Goldman Sachs, The Late 1990s Dot-Com Bubble Implodes in 2000; Britannica Money; EBSCO Research Starters
The AI Big 10 Today (Around 40%)
Today, the ten largest artificial intelligence names sit near 40% of the S&P 500. That places the AI bubble squarely within the same range that marked previous peaks.
Why Concentration Is a Recurring Warning Sign
The assets differ (railroads, blue chips, Japanese equities, internet stocks, and now artificial intelligence), yet the pattern rhymes. Stretched stock market valuations in a narrow group have preceded major drawdowns again and again, which is the core worry behind the AI bubble.
We don’t read this as a forecast of timing, since no one rings a bell at the top. It’s more of a reason to respect elevated risk rather than chase the crowd.
What Higher Prices and Higher Risk Mean for Investors
Two things are true at the same time: stock prices are higher, and the risks are higher. That combination warrants a more conservative, defensive stance, not panic.
For long-term investors, the goal is to participate thoughtfully while guarding against permanent loss. Reacting emotionally to the AI bubble usually does more harm than positioning deliberately for it, in line with WealthArch’s investment approach.
In practice, WealthArch leans on a few habits when prices look stretched:
- Favoring companies whose stock prices trade below their underlying value
- Holding bonds and money markets alongside stocks, rather than crowding into one segment
- Sizing positions so that no single theme can sink a portfolio
How WealthArch Approaches Frothy Markets
We practice value investing in the spirit of Warren Buffett. Our first rule is simple: don’t lose money.
A Built-In Margin of Safety
That discipline begins with a margin of safety, a buffer between a company’s stock price and its underlying worth. By insisting on that buffer, WealthArch lowers the risk of permanent loss and helps reduce portfolio swings when markets grow crowded.
An Anchor Across Stocks, Bonds, and Money Markets
We invest across stocks, bonds, and money markets, so client portfolios are not tied to whatever segment happens to be in favor. When something like the AI bubble grips the market, the firm often serves as the anchor of a client’s wealth, which can free them to take measured risk elsewhere.
Updates That Keep Clients Informed
Clients also stay informed. Portfolio manager Earl Yaokasin, who holds the CFA designation and keeps his entire personal portfolio in the same investments as his clients, shares detailed updates after earnings reports and whenever macro events like a new CPI inflation reading could affect holdings.
Talk to WealthArch About Today’s Market
WealthArch Investment Services helps successful professionals and institutions position themselves for markets like this one. If the AI bubble has you weighing your exposure, the firm’s team of advisors can review your portfolio with you and explain exactly how it is built.